
International Journal Chaos and Correlation, No 1, November 30, 2006
Theory and constants of wall turbulence
A. P. Trunev
Abstract. The completely closed model of wall turbulence was derived directly from the Navier-Stokes equation. The fundamental constants of wall turbulence including the Karman constant have been calculated within a theory. This model has been developed also for the accelerated and non-isothermal turbulent boundary layer flows. The estimated mean velocity, temperature and impurity concentration profiles as well as the spectral characteristics of the streamwise velocity component are to be shown in a good agreement with the experimental data.
1 Introduction
Nikuradse [1] found that the turbulent boundary layer structure includes the region where the mean velocity increases with the distance from the wall as a logarithmic function
 ........................................... (1) ........................................... (1)
where  is the friction velocity, is the friction velocity,  , ,  is the wall shear stress, is the wall shear stress,  is the fluid density, z is the distance from the wall, is the fluid density, z is the distance from the wall,  is the kinematic viscosity. Nikuradse [1] established that is the kinematic viscosity. Nikuradse [1] established that  for turbulent flows in smooth pipes. for turbulent flows in smooth pipes.
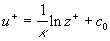
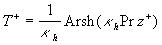
The logarithmic law (1) has been confirmed by many and many researchers of turbulence [2-7, 13-14,17]. Recently it was shown [5] that the log law can be excellent agreed with the experimental pip flow data for  , where , where  is the pip radius. For this range the log law constants were shown to be is the pip radius. For this range the log law constants were shown to be  . Also the log law was confirmed for a zero pressure gradient turbulent boundary layer flow in the precise wind-tunnel experiment [6] and the constants were obtained . Also the log law was confirmed for a zero pressure gradient turbulent boundary layer flow in the precise wind-tunnel experiment [6] and the constants were obtained  . To estimate the Karman constant the normalised local slope of the mean velocity profile has been used as follows . To estimate the Karman constant the normalised local slope of the mean velocity profile has been used as follows  where where  is the inner layer variable - see Figure 1a. is the inner layer variable - see Figure 1a.
So this universal law can be considered as a fundamental fact of the theory of turbulence. Nevertheless it may be wonder that this law never been derived from "first principles" excepting the similarity theory (see the typical arguments in ref. [2-8] and other).
To derive this law we can begin with simple assumption that the logarithmic profile of velocity is a fragment in solution of hydrodynamics equations of viscous fluid in a form of Navier-Stokes. Thus the way a question is put can be different: how the initial equations should be transformed so that in their solution boundary layer should contain logarithmic profile? This type of transformation was developed recently [9-11]. The idea of transformation is rather simple and as a matter, was driven at bringing into initial system equations of some set of random parameters, describing fluctuations of conventional boundary of viscous sublayer.
To understand this idea we should note that the logarithmic distribution (1) is a typical mean velocity profile measured in the turbulent flow bounded by a smooth wall. In a case of the turbulent flow over a rough wall Nikuradse [12] established (for sand-roughened pipes) that if the roughness height significantly exceeds the viscous sublayer thickness, then the mean velocity profile can be described by the logarithmic function as follows:
 ........................................... (2) ........................................... (2)
where  is the characteristic scale of the sand roughness, is the characteristic scale of the sand roughness,  are empirical values (Nikuradse found that are empirical values (Nikuradse found that  for the completely rough regime). for the completely rough regime).
The sentence "the roughness height significantly exceeds the viscous sublayer thickness" means only that  or in another form or in another form  . Obviously that . Obviously that  is the roughness Reynolds number and is the roughness Reynolds number and  is the characteristic thickness of viscous sublayer. Compared equations (1) and (2) one can conclude that there is an universal model described the turbulent boundary layer flows over smooth and rough surfaces. As it was shown [9-11] this model can be derived directly from the Navier-Stokes equation and that the logarithmic distribution is an asymptotic solution of this model. is the characteristic thickness of viscous sublayer. Compared equations (1) and (2) one can conclude that there is an universal model described the turbulent boundary layer flows over smooth and rough surfaces. As it was shown [9-11] this model can be derived directly from the Navier-Stokes equation and that the logarithmic distribution is an asymptotic solution of this model.
2 Principles of theory
Let  is a function describing the roughness geometry and is a function describing the roughness geometry and  is the thickness of viscous sublayer. The dynamic roughness surface can be defined as follows is the thickness of viscous sublayer. The dynamic roughness surface can be defined as follows  . Thus the mean dynamic roughness height is given by . Thus the mean dynamic roughness height is given by  , where , where  is the dimensionless thickness of viscous sublayer. It should be noted that in the case of a smooth plate for is the dimensionless thickness of viscous sublayer. It should be noted that in the case of a smooth plate for  the dynamic roughness surface equals to the viscous sublyer conventional surface i.e. the dynamic roughness surface equals to the viscous sublyer conventional surface i.e.  . .
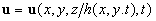
In Figure 1b the frequency diagram [13] of instantaneous thickness of a viscous sublayer in the turbulent boundary layer over a smooth surface is shown. The maximum of frequency diagram is established for  . The first maximum of the inverse normalised local slope of the mean velocity profile . The first maximum of the inverse normalised local slope of the mean velocity profile 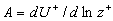 also locates approximately at also locates approximately at  - see Figure 1a. Thus one can put - see Figure 1a. Thus one can put  . .
For the flow over a smooth surface we have  and in this case the logarithmic velocity distribution in the form (1) is realised. When and in this case the logarithmic velocity distribution in the form (1) is realised. When  and therefore and therefore  then the mean velocity profile can be described by eq. (2). This two cases can be described automatically if the flow velocity vector, then the mean velocity profile can be described by eq. (2). This two cases can be described automatically if the flow velocity vector,  , can be written as follows , can be written as follows
 ........................................... (3) ........................................... (3)
Figure 1: a) The inverse normalised local slope of the mean velocity profile estimated from the van Driest model [14]- the solid line 6 and from the experimental data by Österlund [6] (1-4). Horizontal solid line (5) corresponds to the estimated quantity  ; b) the frequency diagram of instantaneous thickness of viscous sublayer in the turbulent boundary layer over a smooth wall [13]. ; b) the frequency diagram of instantaneous thickness of viscous sublayer in the turbulent boundary layer over a smooth wall [13].
If the streamwise velocity has a logarithmic asymptotic,  , then also the mean velocity has the logarithmic asymptotic, , then also the mean velocity has the logarithmic asymptotic,  . .
Unfortunately this very simple idea can’t be used directly by substituting expression (3) in the Navier-Stokes equation, because the dynamic roughness surface can’t be described by a regular function in a common case.
Therefore the dynamic roughness surface is advised to characterise by the set of the random continuous parameters , with a well-known function of distribution , with a well-known function of distribution  . The reason why only the first odder derivatives of the function . The reason why only the first odder derivatives of the function  play role in this theory is explained by the volume averaging used for a filtration of random functions. play role in this theory is explained by the volume averaging used for a filtration of random functions.
We suppose that  and let us consider a representative region of flow by a volume and let us consider a representative region of flow by a volume  , where , where  are typical scales of flow in the x, y directions accordingly. Then let us consider subregion are typical scales of flow in the x, y directions accordingly. Then let us consider subregion  lying in the representative region of the flow, lying in the representative region of the flow,  , in which the random parameters , in which the random parameters  are changed in the intervals are changed in the intervals  , ,  , ,  , ,  accordingly. The volume of this subregion is given by accordingly. The volume of this subregion is given by
 . .
The random function describing the flow velocity can be determined by the toting expression in the volume  : :
where  is an arbitrary volume enclosed in and containing as a whole. is an arbitrary volume enclosed in and containing as a whole.
Obviously,  is the random function, because it depends on the random parameters. The equations describing dynamics of random functions is the random function, because it depends on the random parameters. The equations describing dynamics of random functions  immediately follow from the hydrodynamic equations of viscous fluid [9-11]. Statistical moment of an order immediately follow from the hydrodynamic equations of viscous fluid [9-11]. Statistical moment of an order  of the random function of the random function  are determined as follows are determined as follows
 . .
This algorithm is a very effective in the wall turbulence problem because in this case the random functions  with fixed variables with fixed variables  have the properties which are similar to the mean flow parameters. Otherwise for the solutions presented for instance by the logarithmic function we can suppose that have the properties which are similar to the mean flow parameters. Otherwise for the solutions presented for instance by the logarithmic function we can suppose that
 , ,
where the parameters with stars can be estimated from the comparison of solutions with experimental data or calculated from a theory considered below.
A zero pressure gradient turbulent boundary layer over a smooth surface can be described by the completely closed equation system derived directly from the Navier-Stokes equation (see [10-11] for details). Utilised the inner layer variables this model can be written in the form
 , ........................................... (4) , ........................................... (4)
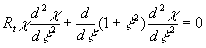 , , 
where  , ,  , , 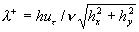 is the characteristic dimensionless scale of the viscous sublyer, is the characteristic dimensionless scale of the viscous sublyer, 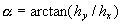 , ,  , ,  , , , ,  is the second scale of velocity in the wall turbulence, is the second scale of velocity in the wall turbulence,  is the Reynolds number calculated on the dynamical roughness parameters (it should be noticed that the random parameters is the Reynolds number calculated on the dynamical roughness parameters (it should be noticed that the random parameters  are not functions of time or space variables!). are not functions of time or space variables!).
The boundary conditions for Eq. (4) are set as follows
 ........................................... (5) ........................................... (5)
where  is a free (shooting) parameter. is a free (shooting) parameter.
It should be noted that model (4) is related to the Blasius equation in the particular case when  , ,  and and  . .
3 Constants of wall turbulence
Let us suppose that for  the streamwise mean velocity profile has a logarithmic asymptotic, i.e. the streamwise mean velocity profile has a logarithmic asymptotic, i.e.
 . .
Surmising that  we have from the first equation (4): we have from the first equation (4): 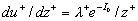 , and therefore , and therefore  . The last equation gives the continuous spectrum of the turbulent scales . The last equation gives the continuous spectrum of the turbulent scales  . Used the dynamic roughness Reynolds number in the form . Used the dynamic roughness Reynolds number in the form  the equation can be rewritten as follows the equation can be rewritten as follows
For an uniqueness of the mean velocity profile we can suppose that for  the second turbulent velocity scale has a stable value at small variations of the parameter the second turbulent velocity scale has a stable value at small variations of the parameter  , i.e. , i.e.  . It gives . It gives  . The turbulent boundary layer fundamental scale can be defined as . The turbulent boundary layer fundamental scale can be defined as  . This quantity approximately equals to the experimental value . This quantity approximately equals to the experimental value  for for  . .
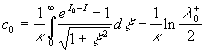
The function  can be considered as a spectral density. The inverse length scale versus the Reynolds number is shown in Figure 2a. This type of a spectral density is similar to the spectral density of the streamwise velocity fluctuations in the turbulent boundary layers. The function can be considered as a spectral density. The inverse length scale versus the Reynolds number is shown in Figure 2a. This type of a spectral density is similar to the spectral density of the streamwise velocity fluctuations in the turbulent boundary layers. The function  is shown in Figure 2b. This type of spectrum is similar to the spectral density of the transversal velocity pulsation [15]. Both functions represent the constructive model of the hydrodynamic chaos in this theory of turbulence. is shown in Figure 2b. This type of spectrum is similar to the spectral density of the transversal velocity pulsation [15]. Both functions represent the constructive model of the hydrodynamic chaos in this theory of turbulence.
Figure 2: a) The inverse length scale  versus the Reynolds number of dynamic roughness in double logarithmic scale. This type of a spectral density is similar to the spectral density of the streamwise velocity fluctuations in the turbulent boundary layers; b) the normalised turbulent velocity scale versus the Reynolds number of dynamic roughness in double logarithmic scale. This type of a spectral density is similar to the spectral density of the streamwise velocity fluctuations in the turbulent boundary layers; b) the normalised turbulent velocity scale  versus the Reynolds number of dynamic roughness. This type of spectrum is similar to the spectral density of the normal to the wall velocity pulsation. versus the Reynolds number of dynamic roughness. This type of spectrum is similar to the spectral density of the normal to the wall velocity pulsation.
Our suggestion about the dynamical roughness structure in the wall region is that the parameter  fluctuates around the mean value fluctuates around the mean value  . This structure looks like furrows elongated along of the mean flow stream lines in the viscous sublayer (see, for instance, [16] where the visualisation of the coherent structure in the turbulent boundary layer is presented). In this case the first Eq. (4) can be integrated once and the standard logarithmic profile can be derived for . This structure looks like furrows elongated along of the mean flow stream lines in the viscous sublayer (see, for instance, [16] where the visualisation of the coherent structure in the turbulent boundary layer is presented). In this case the first Eq. (4) can be integrated once and the standard logarithmic profile can be derived for  : :
 , ,  . .
Therefore, with the given constant  another constant of the mean velocity logarithmic profile can be calculated from the last equation. another constant of the mean velocity logarithmic profile can be calculated from the last equation.
4 Spectral characteristics of wall turbulence
The spectral density of the streamwise velocity pulsation can be defined as follows
where  is the characteristic radian frequency, is the characteristic radian frequency,  is the flow wave number (Taylor's frozen turbulence hypothesis). To compare the spectral density with experimental data let us suppose that is the flow wave number (Taylor's frozen turbulence hypothesis). To compare the spectral density with experimental data let us suppose that  , Therefore the Reynolds number calculated on the dynamical roughness parameters depends on the frequency, , Therefore the Reynolds number calculated on the dynamical roughness parameters depends on the frequency,
where  is the typical turbulent length scale of the streamwise velocity pulsation, is the typical turbulent length scale of the streamwise velocity pulsation,  is the boundary layer height, is the boundary layer height,  . Due to this relationship the spectral characteristic of the turbulent flow is related to the eigen spectrum of the value problem (4-5). In general case it can be like the power series . Due to this relationship the spectral characteristic of the turbulent flow is related to the eigen spectrum of the value problem (4-5). In general case it can be like the power series
 . .
Practically we can test one first term of this series. Then the spectral density can be proposed in the form
 ........................................... (6) ........................................... (6)
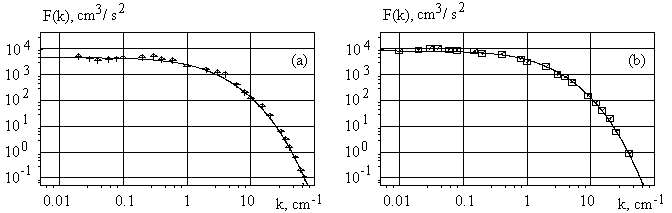
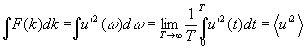
Figure 3:The estimated spectral density of the streamwise velocity pulsation in the turbulent channel flow (solid lines) for  (a), and (a), and  (b), and the experimental data [17] (b), and the experimental data [17]
where  is the normalising factor. Suggesting that the flow wave number depends on the dynamical roughness Reynolds number as the linear function, i.e. is the normalising factor. Suggesting that the flow wave number depends on the dynamical roughness Reynolds number as the linear function, i.e.  , we have , we have 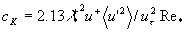 . .
The spectral density given by Eq. 6 is shown in Figure 3 (solid lines) together with the experimental data [17] obtained in the turbulent channel flow. As it was established both spectral density parameters slowly depend on the distance from the wall. The best correlation was found in the viscose sublayer for   (Figure 3a) and for , (Figure 3a) and for , , , (Figure 3b). (Figure 3b).
5 Thermal turbulent boundary layer
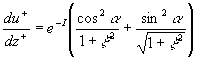
The model of turbulent flow (4) was developed to estimate the turbulent transport of heat and impurities in the boundary layer. The mean temperature gradient can be written as follows (see [10-11] for details)
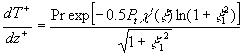 ........................................... (7) ........................................... (7)
where  , ,  is the surface temperature, is the surface temperature,  is the turbulent flow temperature, is the turbulent flow temperature, 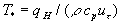 is the turbulent scale of temperature, is the turbulent scale of temperature,  is the heat flux from the rigid surface to the flow, is the heat flux from the rigid surface to the flow,  is the specific heat at constant pressure of the gas, is the specific heat at constant pressure of the gas,  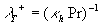 is the main turbulent scale of the thermal layer, is the main turbulent scale of the thermal layer,  is the Peclet number. is the Peclet number.
The boundary conditions for equation (12) on a smooth wall and for the long distance from the wall are given by
 ........................................... (8) ........................................... (8)
 , ,
where  is a constant which approximately equals to the Karman constant. is a constant which approximately equals to the Karman constant.
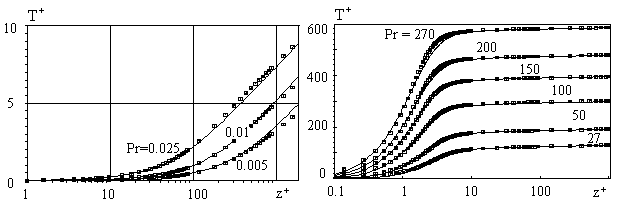
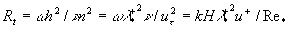
Figure 4. Mean temperature profiles in the turbulent boundary layer computed for the small (left) and for the large Prandtl numbers (right). The square symbols -the model of Sebeci [18]; the solid lines - the model (7-9).
In special case when  a general solution of the boundary value problem (7)-(8) can be written as follows: a general solution of the boundary value problem (7)-(8) can be written as follows:
 ........................................... (9) ........................................... (9)
The mean temperature profiles computed on equations (7), (9) are shown in Figure 4 (right) by solid lines together with the profiles computed on the model of Sebeci [18] - the square symbols. For the best correlation the function  was numerically approximated as follows was numerically approximated as follows in the range of the Prandtl number in the range of the Prandtl number  . The agreement between two models in general is good. . The agreement between two models in general is good.
It should be noted that equation (7) is a typical two-scale model describing the interaction between the transition layer with  and thermal boundary layer with the main scale . Considering the mean flow as a "substance" with the Prandtl number and thermal boundary layer with the main scale . Considering the mean flow as a "substance" with the Prandtl number  we can utilized equation (7) also to describe the mean velocity profile. we can utilized equation (7) also to describe the mean velocity profile.
6 Multi-scale model
Analysing data shown in Figure 1a one can found the several layers of different scale:
The viscous syblayer  ;
The transition layer which corresponds to the first maximum of ;
The transition layer which corresponds to the first maximum of  for for  ;
The logarithmic layer where ;
The logarithmic layer where  ;
The mixing layer or the "wake region" [19] which corresponds to the second maximum of for ;
The mixing layer or the "wake region" [19] which corresponds to the second maximum of for  ;
The free stream region where ;
The free stream region where for for  .
.
With this scales the model of turbulence (4) has been developed for the case of turbulent boundary layer flow in pressure gradient as follows
where  , ,  , ,  is the dimensionless pressure gradient, is the dimensionless pressure gradient,  is the middle position of the mixing layer. is the middle position of the mixing layer.
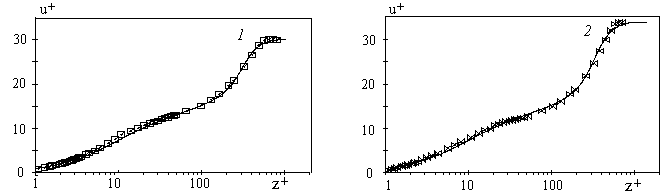
Figure 5: The estimated mean velocity profiles in the turbulent boundary layer in adverse pressure gradients computed for p+=0.023; 0.0251 - the solid lines 1-2 accordingly, and experimental data (symbols) from the data base by Nagano et al [20].
The function of pressure gradient parameter has been estimated from the experimental data by Nagano et al [20]  for adverse pressure gradients. The computed mean velocity profiles in the turbulent boundary layer in adverse pressure gradients are shown in Figure 5 together with the experimental data [20]. for adverse pressure gradients. The computed mean velocity profiles in the turbulent boundary layer in adverse pressure gradients are shown in Figure 5 together with the experimental data [20].
7 Final closure and conclusion
Generally speaking the Karman constant also should be defined as a function of this parameter because the two-scale model (7) depends on the length scale  which can be related to the fundamental length scale which can be related to the fundamental length scale  . Used a symmetry of the multiple density of a probability distribution function . Used a symmetry of the multiple density of a probability distribution function  one can defined the length scale corresponding to a negative value one can defined the length scale corresponding to a negative value  as follows as follows 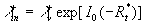 and consequently the scale of velocity and consequently the scale of velocity  . Both scales depend on the main scales . Both scales depend on the main scales  due to a symmetry so that due to a symmetry so that  . Therefore the Karman constant should be defined as follows . Therefore the Karman constant should be defined as follows
 ........................................... (10) ........................................... (10)
The formula (10) gives  for for  . This result is presented in Figure 1a by the horizontal line 5. . This result is presented in Figure 1a by the horizontal line 5.
We have demonstrated the completely closed theory of wall turbulence. The main parameter of this theory was established as the Reynolds number of dynamic roughness  . This parameter has been calculated within a theory based on the mean velocity profile asymptotic behaviour as . The Karman constant and the turbulent boundary layer fundamental length scale have been defined as functions of this parameter. The estimated parameters , and mean velocity and temperature profiles are in a good agreement with the available experimental data. . This parameter has been calculated within a theory based on the mean velocity profile asymptotic behaviour as . The Karman constant and the turbulent boundary layer fundamental length scale have been defined as functions of this parameter. The estimated parameters , and mean velocity and temperature profiles are in a good agreement with the available experimental data.
References
Nikuradze, J. Gesetzmaessigkkeiten der turbulenten Stroemung in glatten Rohren, Forsch. Arb. Ing. Wes., 356, 1932.
Schlichting, H. Boundary Layer Theory, McGraw-Hill, NY, 1979.
Purtell, L. P., Klebanoff, P. S. & Buckley, F. T. Turbulent Boundary Layers at Low Reynolds Number. Phys. Fluids, 24(5), 802-811, 1981.
Smith R. W. Effect of Reynolds Number on the Structure of Turbulent Boundary Layers, Ph.D. Thesis, Princeton University, 1994.
Zagarola, M. V. & Smits, A. J. A New Mean Velocity Scaling For Turbulent Boundary Layers, Proceedings of FEDSM’98, 1998 ASME Fluids Engineering Division Summer Meeting, June 21-25, 1998, Washington DC, 1998.
Österlund, J.M. Experimental studies of zero pressure gradient turbulent boundary layer flow. Doctoral thesis. Stockholm, 1999.
Fernholz, H. H. & Finley, P .J. The incompressible zero-pressure-gradient turbulent boundary layer: An assessment of the data. Prog. Aerospace Sci. 32 , pp. 245 –311,1996.
Millikan, C. M. A Critical Discussion of Turbulent Flows in Channels and Circular Tubes, Proc. 5th Int. Congr. Appl. Mech. (Wiley, NY) 386-392,1938.
Trunev A. P. Similarity theory for turbulent flow over natural rough surface in pressure and temperature gradients. Air Pollution IV. Monitoring, Simulation and Control ed. B. Caussade, H. Power and C. A. Brebbia (Comp. Mech. Pub., Southampton) 275-286. 1996.
Trunev A. P. Theory of Turbulence and Model of Turbulent Transport in the Atmospheric Surface Layer, Russian Academy of Sciences, Sochi, 160 p., 1999. http://www.trounev.com/Math/Books/index.html
Trunev A. P. Theory of Turbulence and Turbulent Transport in the Atmosphere. 180 p., 2001. http://www.trounev.com/Math/Books/index.html
Nikuradse J. Strömungsgesetze in Rauhen Rohren ForschHft. Ver. Dt. Ing., 361, 1933.
Kutateladze S. S. Wall Turbulence (Nauka, Novosibirsk) p.102, 1973.
Van Driest, E. R. On turbulent flow near a wall, J. Aero. Sci. 23,1007,1956.
Tennekes H. & Lumley J. L. A First Course in Turbulence, MIT Press, Cambridge, Massachusetts, 1972.
Cantwell B. J., Coles D. E. & Dimotakis P. E. Structure and entrainment in the plane of symmetry of a turbulent spot J. Fluid Mech, 87, 641-672, 1978
Hussain A. K. M. F. & Reynolds W. C. Measurements in fully development turbulent channel flow, J. Fluid Ing. 97, 568-80, 1975.
Cebeci T. A model for eddy conductivity and turbulent Prandtl number, J. Heat Transfer, 95, 227, 1973.
Coles, D. E. The law of the wake in the turbulent boundary layer. J.Fluid Mech.1 , pp.191 –226, 1956.
Nagano, Y., Kasagi, N., Ota, T., Fujita, H., Yoshida, H. & Kumada, M., Data-Base on Turbulent Heat Transfer, Department of Mechanical Engineering, Nagoya Institute of Technology, Nagoya, DATA No. FW BL004, 1992.
|