The turbulent flow is characterized by the chaotic pulsation
of the flow parameters, intermittence and complex eddy motion.
The surface, which separates the turbulent flow and the outer flow,
looks like the rough surface.
The turbulent boundary layer is an example of turbulent flow.
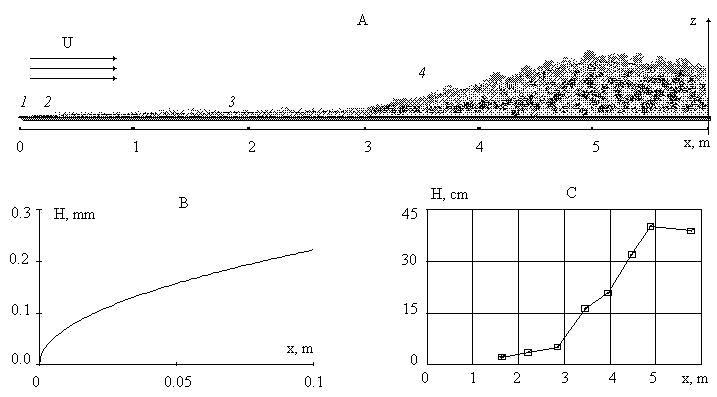
The turbulent boundary layer is a typical self-organized flow formed around any rigid body moving in the viscose fluid at high Reynolds number. To illustrate the common problems of the boundary layer theory let us consider the structure of the flat plate boundary layer in adverse pressure gradient - Figure 1. This flow includes the laminar boundary layer (1), the transition flow (2), the turbulent boundary layer (3) and the separated turbulent flow (4).
The laminar boundary layer is the predictable and well-investigated flow. But this flow is not a stable at high Reynolds number, because it can be like the amplifier for the waves of small amplitude.
The transition layer has a complex structure included seven sub-regions:
- The laminar flow region in which the small disturbances are generated. This part of flow is considered often as a starting point of transition layer. The Reynolds number of initial point of transition layer is a very sensitive to the boundary conditions on the wall and in the outer flow. The estimated Reynolds number of transition zone is between 4*105 and 4*106;
- The quasi-laminar flow region in which the amplitude of linear waves (called the Tollmien-Schlichting waves) grows up to the critical value 10-2. The typical scale of this region is about Lx=100H, where H is the local thickness of the boundary layer;
- The nonlinear critical layer where the interaction between waves and main flow leads to the new unstable state. The typical scale of this region can be estimated as Lx =10H;
- 3D waves region with scale Lx =H. In this region initial two-dimensional waves are transformed into three-dimensional waves;
- The region of the secondary instability in which the short length waves are generated. The typical scale of this zone is about Lx =0.1H ;
- The Emmons sports region with typical scale Lx =H. In this part of flow the non-equilibrium process leads to the turbulent spectrum of velocity fluctuations;
- The initial region of the turbulent flow in which the amplitude of velocity pulsation is about 3*10-2U.

Figure 1: A) The boundary layer in adverse pressure gradient: 1 - laminar boundary layer; 2 - transition layer; 3 - turbulent boundary layer; 4 - turbulent separated flow; B) the thickness of the laminar boundary layer in the air flow for the free stream velocity U=31.47 m/s; C) the mean height of the separating boundary layer.
The transition from the laminar flow to the turbulent flow is a very attractive phenomenon from the mathematical point of view. Indeed the initial laminar flow, which is not consist of any chaotic waves, then suddenly transforms to the state with a chaotic behaviour.Many
authors have investigated this problem of transformation called "dynamical
chaos". See for instance
http://hypertextbook.com/Chaos/
The theory of the "dynamical chaos" is based mostly on the simplifier dynamical systems (Lorenz-like chaos) which can't be used directly for the boundary layer problem.
The fractal geometry theory developed by
Benoit Mandelbrot also has been utilized to explain
the chaos and intermittence in the hydrodynamic turbulence.
Rough wall turbulence
The study of the rough wall turbulence is important in fluid mechanics, in the atmosphere and ocean and in engineering flows. The rough surface effect on the turbulent boundary layer has been considered by Nikuradse (1933), Schlichting (1936, 1960), Bettermann (1966), Dvorak (1969), Simpson (1973), Dirling (1973), Dalle Donne & Meyer (1977), Jackson (1981), Osaka & Mochizuki (1989), Raupach (1992) and other.
Nikuradse (1933) established (for sand-roughened pipes), that if the roughness height significantly exceeds the viscous sublayer thickness, then the mean velocity profile can be described by the logarithmic function.
To read more about the turbulent flows over rough surfaces please copy Chapter3.zip file 556K with MS Word97 doc Model of turbulent flows over rough surfaces by A P Trunev .
Turbulent flow parameters
The mostly important flow parameters are the pressure, temperature and three components of velocity.
It is practically impossible to measure the flow velocity directly.
For instance the laser-Doppler anemometer fixes the speed of small particles, which are not exactly following the turbulent stream.
Thus to estimate the flow velocity the experimental technique based on the pressure (Pitot-tube probe) and temperature (hot-wire and hot-film anemometry) data is utilized.
Zero pressure-gradient turbulent boundary layer data from measurements in the wind-tunnel is available from
Jens Osterlund.
